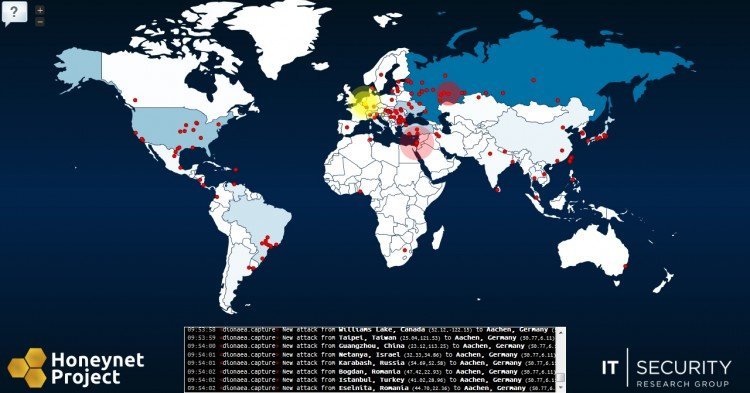
Honeynet Project offers the possibility to have a beautiful view over how Cyberattacks are spread around the Globe. The red dots on the map represent the attacks and the yellow one are the systems/sensors that record the attacks.
The black box presents the location of the attacks based on the IPs of the machines used. This is only part of the actual number of the attacks. The “Cyber War” is a lot more intense and hard to log on a map. But just for fun, we can have a beautiful image of how attacks are spread over internet.
Visit map.honeycloud.net for the map.
Via [The Atlantic Wire]

